
I’ve previously posted on the importance of colour in my life and mentioned that it was important for making food choices. How many people remember the fuss when blue M&Ms first came out?
A couple of weeks ago, Cognitive Daily blogged on the language of color and on how eye structure influences color categories and Pharyngula reposted a blog entry on the evolution of the eye, which included information on mammalian and arthropod photoreceptors. These fitted into my research interests as I am interested in how food changes colour during processing and storage. I am actually interested in all chemical changes during processing and storage, but colour changes usually are the most obvious. I’ve been reading more neuroscience as I want to know more about the neurochemistry of color especially how perception alters expectations. That, however, will have to be a topic of another post as I still have lots more reading to do before I understand it enough to write about it.
For this post, I am concerned about how to measure food colour. It is not easy. We could just ask people what colour something is, but our perception of color changes is not very sensitive and there is also the effect of the nature of the material being measured. Glossy versus matt, smooth surfaces versus rough, small particles versus large can all alter our perception of colour. It also can be inconvenient to ask some one every time you create a new food color – is this blue? Is it as blue as this blue?
Visible light is the visible part of electromagnetic spectrum. Electromagnetic radiation also includes microwaves and x-rays. When light hits a colored material with enough energy, electrons in the colored material are promoted to higher levels which we see as colour, as the materials are able to absorb light at certain frequencies.
Translucent liquids allow certain wavelengths of light through and absorb others giving color. The color of these liquids can be measured by determining the wavelength that is absorbed or transmitted. The most common way is to use a ultra-violet/visible (uv-vis) spectrophotometer. These spectrophotometers can measure electromagnetic radiation from 250 nm to 750 nm. Just so you can get an idea of how this fits with other electromagnetic radiations, the wavelengths of microwave radiation are 0.75 – 3.75 mm (750 – 3750 nm) and x-rays are 10 – 0.001 nm.
I use this slide to describe uv-vis spectrophotometry to my food analysis class:
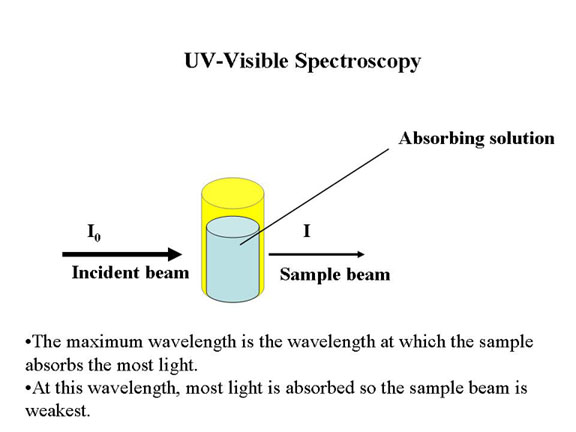
Light entering the sample is at single wavelength. If the wavelength maximum is unknown, certain spectrophotometers can scan the sample at different wavelengths. The result is a spectrum.
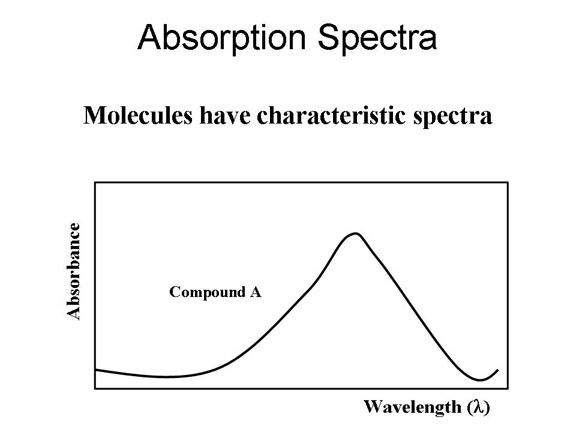
From the spectrum, the wavelength max can be determined and this can be used to determine the color of the solution. Spectrophotometers are also used to determine the presence and concentration of absorbing compounds.
Unfortunately most food are made of nontransparent material so colour cannot be measure using a spectrophotometer. Instead we can do something called colorimetry, which is describing colors with numbers or doing a color measure by instrumental means. The simplest is to compare and contrast with standard colors, a bit like using paint chips. Talking of chips, the color potato chips, crisps and French fries are checked against a potato chip color reference chart, which can be purchased from the Snack Food Association. Other industries will also have their standard reference charts.
These charts still require an observer to match colors, which can lead to subjective results. So other methods were developed to determine the color space, which convert color into numbers in 3D space. These numbers can be used to refer to a colour as names can be very confusing as I have found out one Saturday, many moons ago. I bought three different items of clothing – all apparently coloured with “Berry”. One was a rich purple, one was a deep raspberry red and the third some where in between. Yep, color names are confusing. Every bought paint? What color is apple blossom anyhow?
An example of a colour by numbers system is the Munsell System, which gives numbers for hue, lightness/darkness and chroma. Hue is the colour of the material, for example whether the object is red, green, or blue and chroma is the intensity. On the lightness/darkness scale, pure black is zero and pure white is 10. There is a Munsell colour atlas where over a thousand colors are listed with their numbers.
The most common system in food science is the L a b system. There are two systems currently in use, CIE (1976) LAB and Hunter L a b system. Both Hunter L a b and CIELAB system are based on the CIE XYZ system which was developed in 1931. The idea was to base the numbers on what is perceived by the human eye with its blue, green and red photoreceptors. Both the CIELAB and Hunter L a b systems were developed to linearlize color differences. Each color system gives different numbers for L a and b. The actual differences between CIELAB and Hunter L a b are down the mathematical conversion of the values from the older CIE XYZ method. The details of which just made my head spin, so I won’t go into it here.
The CIE 1976 L* a* b* system is the standard system as designated by the Commission Internationale d’Eclairage.
L a b for both systems are defined as (from Wikipedia):
The three parameters in the model represent the lightness of the color (L*, L*=0 yields black and L*=100 indicates white), its position between magenta and green (a*, negative values indicate green while positive values indicate magenta) and its position between yellow and blue (b*, negative values indicate blue and positive values indicate yellow).
BTW these are not the same as the RGB or CMYK colors seen on computers and Adobe Photoshop. These do not describe a complete color space.
I think I have baffled you with science enough for today, but next time you eat, perhaps an apple, think about how the color might have been tested.
—–
Many of my links are to Wikipedia. The articles are not great. I also recommend Susanne Nielsen Food Analysis (Amazon) and HunterLab for more information.

Pingback: OK so I’m not really a cowboy. » Tangled Bank #63
Please send information on whre i can purchase a colour chart for potato chips
Hi Lorraine
If you follow the link I highlighted – it is the word “purchased” in the paragraph about chip color – that should take you to the snack food association page where you can purchase it.
Otherwise try http://www.sfa.org and look for it in their catalogue.
Lab Cat